01 / Load forecasting / Utility planning
Dominion Energy load forecast
A probabilistic forecast of data center electricity demand in Dominion Energy Virginia’s territory (PJM DOM zone), 2025–2035, and what serving it means for capital spending, rate base, customer rates and utility earnings.
01 / The question
How much load is coming, and who pays if it doesn’t?
Planners face a two-sided error. Under-building risks reliability shortfalls and emergency procurement; over-building risks stranded assets whose cost falls on every ratepayer. Data center demand arrives in large, lumpy blocks of 100 to 1,000+ MW per campus, runs nearly flat around the clock and is announced years before it is energized, so a single-point forecast hides the risk.
02 / What the model does
From hourly load to a rate impact, in one reproducible pipeline.
Hourly demand and weather give a weather-normalized organic baseline with historical data center load removed. A hand-compiled, stage-tagged project pipeline becomes probabilistic incremental load. That load is translated into accredited capacity, nameplate build by technology, capital, rate base, revenue requirement, rates and earnings, and compared with a no-new-data-center counterfactual.
| Step | What it does |
|---|---|
| Baseline | EIA-930 hourly load for the PJM DOM sub-region (2019–2025) and population-weighted weather. Existing data center load (5,866 MW connected in 2025) is removed before fitting, so growth is not counted twice. |
| Pipeline | 46 de-duplicated projects, 17,530 MW of grid capacity, each compiled by hand with a source URL and a verbatim capacity quote, tagged by stage from announced to under construction. |
| Simulation | Low / Base / High scenarios plus a Monte Carlo with a common shock to build probability and timing in every draw. |
| Capital and rates | Accredited capacity under PJM FPR and ELCC, capital by technology, rate base, revenue requirement, system-average rate and net income. |
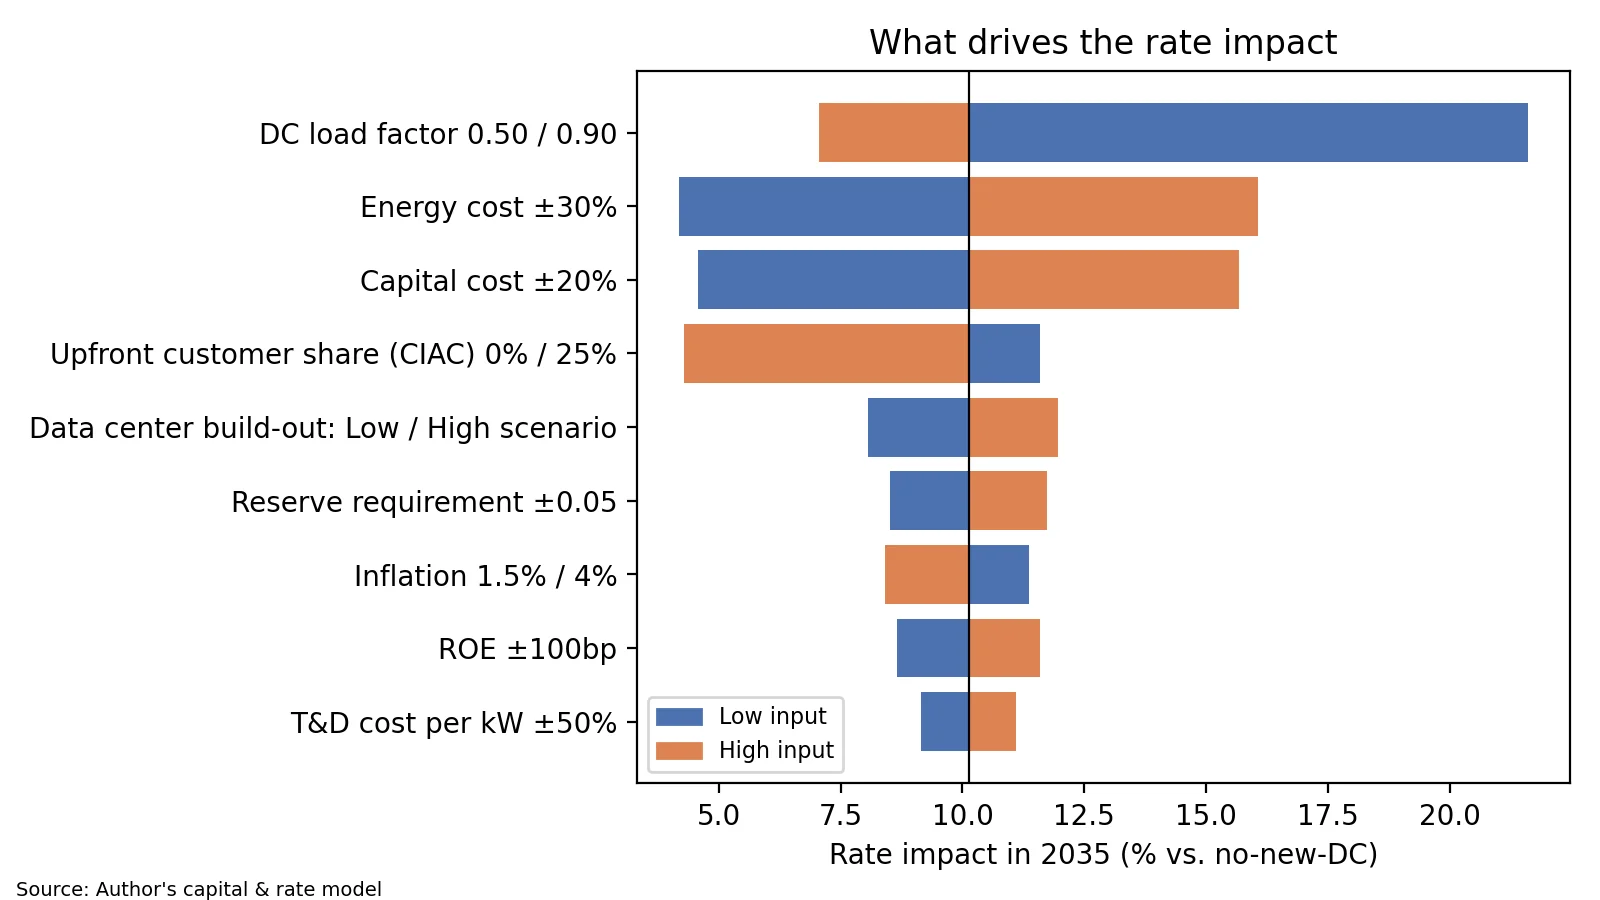
| Risk | Tornado sensitivity, a stranded-load stress test and a GS-5-style large-load tariff. |
03 / The results
Plan to the median, and protect against the downside.
| Scenario | DC peak 2035 (MW) | Capital to 2035 | Rate effect 2035 |
|---|---|---|---|
| Low | 9,234 | $58.6B | +8.1% |
| Base | 13,126 | $83.4B | +10.1% |
| High | 17,753 | $112.8B | +12.0% |
| Monte Carlo median | 12,957 | $82.6B | +10.3% |
Base-case 2035 system peak is 37,013 MW, 8.5% below the PJM 2026 load forecast, and inside the model’s 90% range. The base case raises rate base by $64.7B and annual net income by about $3.3B by 2035. The average rate reaches 15.35 ¢/kWh against 13.93 ¢/kWh in the counterfactual.
04 / Validation
Tested on years the model had not seen.
The organic baseline is trained through 2023 and evaluated on 2024 onward. The daily peak model reaches a MAPE of 5.05%, against 14.33% for a seasonal-naïve benchmark and 16.77% for a trend-only model; the energy model reaches 4.26%. Annual peak errors on the holdout years are 3.9% (2024) and 3.2% (2025). The report also notes where it falls short: four months show a residual bias, and month indicators are the next refinement.
05 / The recommendation
Stage procurement behind signed service agreements.
Plan generation and transmission to the median forecast, stage procurement with explicit decision gates tied to signed Electric Service Agreements, and condition large-load interconnection on tariff protections that place stranded-cost risk on the customers that create it.